UBE in 3 minutes

About UBE
UBE is a manufacturer that produces chemical products and machinery. In particular, its chemical business spans from basic chemical products to advanced high-performance materials. It was founded in 1897 (Meiji 30) in Ube City, Yamaguchi Prefecture. Today, the company delivers products and services from its factories and offices both in Ube City and around the world.


01
Company Info
UBE's products are widely utilized in a range of fields, from everyday items such as automotive parts, digital home appliances, pharmaceuticals, and household goods, to social infrastructure development, including infrastructure structures and buildings.
 External Information


 Internal Information (ESG)


02
History of UBE
The UBE Group has continuously marked a history of transformation, adapting to changes in the times and industrial structure.


03
UBE's Work
We handle a wide range of products, with a focus on the chemical business.


-
Functional Products
- ・Polyimide
- ・Separation Membranes
- ・Ceramics (Silicon Nitride)
- ・Separators
- ・Phenolic Resin
- ・Semiconductor Gas
-
High-Performance Polyurethane
- ・Urethane Systems
- ・High-Performance Coatings
-
Pharmaceutical
- ・Pharmaceutical
-
Resins & Chemicals
- ・Composites
- ・Nylon Polymers
- ・Caprolactam & Ammonium Sulfate
- ・Industrial Chemicals
- ・C1 Chemicals
- ・Elastomers (Synthetic Rubber)
-
Machinery
- ・Molding Machines
- ・Industrial Machinery
-
Others
- ・Electric Power
 Market Share
-

Digitalization of Society
 World's Top Market Share
Polyimide Film
COF Applications for LCD Displays
-
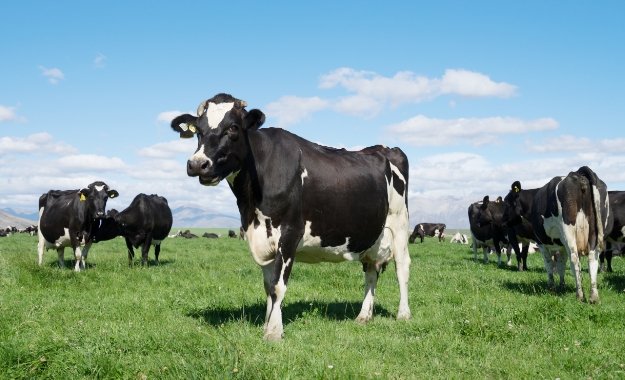
Contribution to Environment and Energy
Track Record of Over 200 Plants Globally
Separation Membranes
CO2 Separation Membranes for Biomethane Production
-
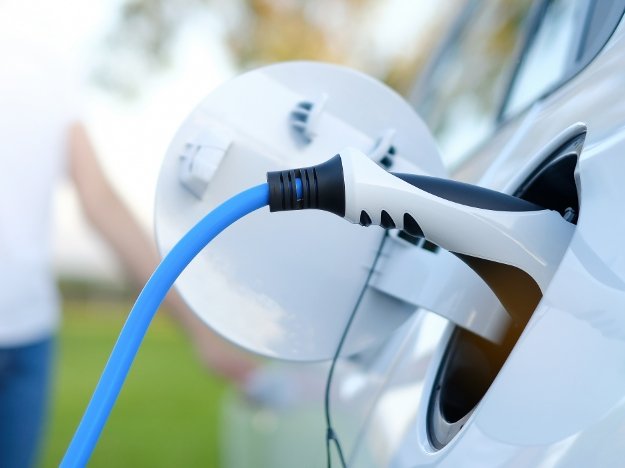
Electrification of Automobiles
Top Manufacturer in High-End Fields
Ceramics (Silicon Nitride)
For Bearings Used in Electric Vehicle Motors
For Heat Dissipation Circuit Boards in Inverters
The only domestic manufacturer
DMC (Dimethyl Carbonate)
Electrolyte Material for Lithium-Ion Batteries
Main Material for Semiconductor Photoresist Developer -
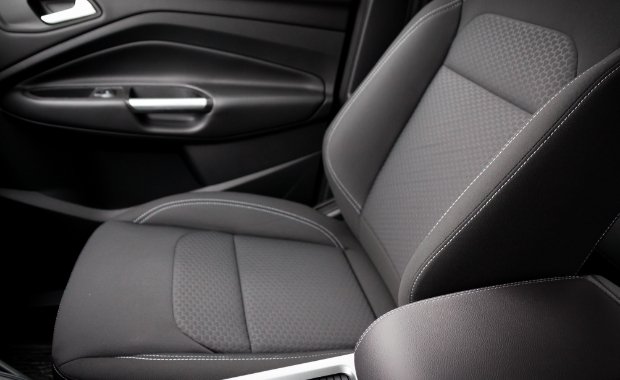
Supporting People's Lives
World's Top Market Share
PCD (Polycarbonate Diol)
Raw Material for High-Grade Urethane Resins (such as Synthetic Leather)
-
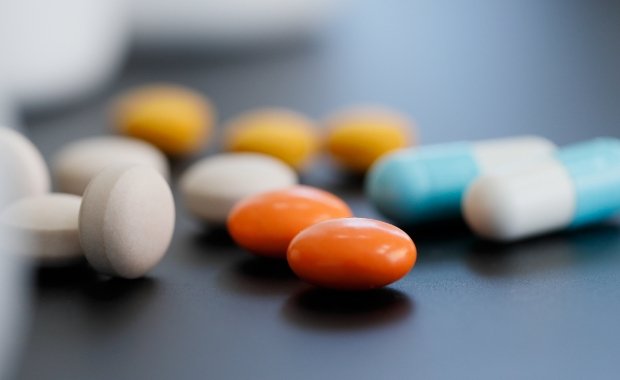
Supporting People's Lives
Jointly Developed Pharmaceuticals with Pharmaceutical Companies: Four Drugs Launched
Drug Discovery Research and CDMO (Contract Development and Manufacturing Organization for Pharmaceuticals)

04
Global Expansion/Sales Ratio
The UBE Group has established major manufacturing bases, including a cluster of factories in Ube City, Yamaguchi Prefecture, as well as in Ichihara City, Chiba Prefecture, and Sakai City, Osaka Prefecture. Internationally, the company has key production sites in Spain and Thailand, with additional sales offices across the world, including China and the United States, delivering high-quality products and services globally.


05
Future Prospects of UBE
With a spirit of exploration and innovation in technology, we create value that leads to the future and contribute to the development of society.


![]()